1. Open, investigate & resolve a problem

QuickStart Guide – Open, Investigate & Resolve a Problem in QED Space
There are various stages in resolving a problem, such as opening a problem, exploring the evidence, checking out potential causes, and taking various actions to see if they can solve the problem. QED Space enables you to systematically perform these steps using Investigation Map™, which has a visualization based on the Fishbone diagram. This visual map puts everyone in the team on the same page quickly, significantly accelerating your problem resolution.
A problem investigation in QED Space typically consists of the following steps:
1. Add a new problem with details in QED Space
a. Create a new problem case
b. Add clues / symptoms as evidence
c. Add Notes and attachments to a clue / symptom
2. Do cause analysis using the Investigation Map™
a. Add potential causes to the QED Fishbone
b. Assign a cause to a collaborator
c. Add notes and attachments to a cause
d. Attach evidence to a cause, i.e., pin clues
e. Add actions taken for a cause
f. Change the fault status
3. Complete the investigation & resolution of the problem
a. Complete cause analysis by marking the fishbone as ‘QED’
b. Document the solution details, if needed
c. Generate summary or detailed reports
d. Close the problem
Below we show you the details of the above steps as performed in smartQED. We also provide some tips for advanced usage.
Step 1: Add a new problem with details in QED Space
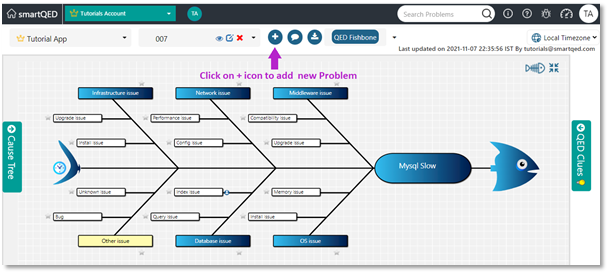
a. Open a new problem
After login, click on the Application for which you want to add the new problem. This takes you to the QED Fishbone screen. Click on the + icon next to the problem drop- down box and enter the problem details in the next screen.
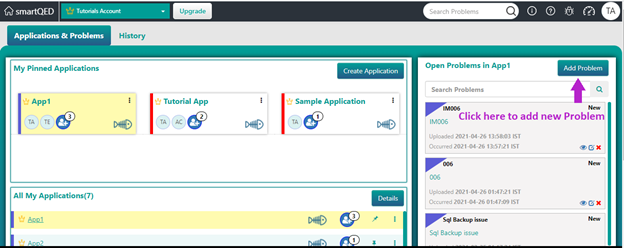
Alternatively, you can add a new problem by clicking on the Add Problem button in the User Activity page.
After entering your data for the new problem, click Save as shown below:
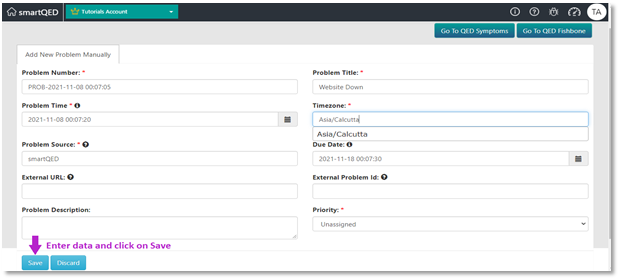
Now you will be taken to the Fishbone page to start the resolution process.
b. Add Clues/Symptoms
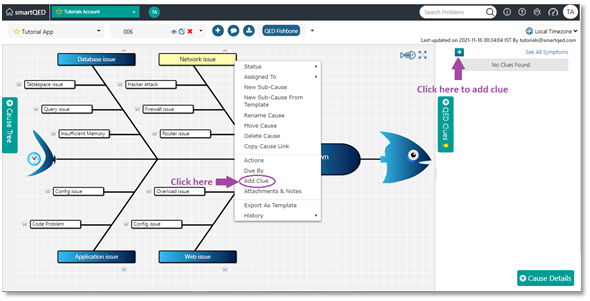
Click on the + sign on top of the QED Clues list on the right in the QED Fishbone page. Optionally you can right click on any cause to create and directly pin the clue to the cause.
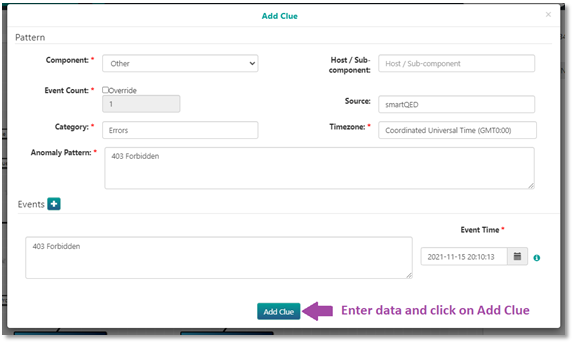
You can enter data related to the clue in the next screen, as shown below. It can include the error message or pattern, when and where it occurred and other details.
After entering the data click Add Clue to save it.
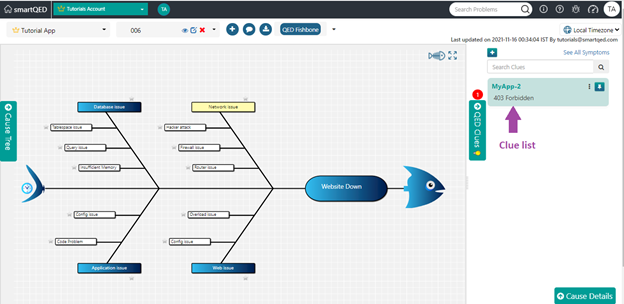
Once saved, the clue you added will appear in the QED Clues list at the right of the Fishbone:
Note: Only the symptoms that are marked as clues are displayed on the QED Clues list. Clues are a subset of all symptoms for a problem – they are the significant symptoms which are directly relevant for problem diagnosis. Each symptom you add manually is marked as a clue by default. You can unmark it to change it to a symptom (see Tips below). To see all the symptoms for a problem, click on QED Symptoms tab at the top.
c. Add Notes and Attachments to a Clue
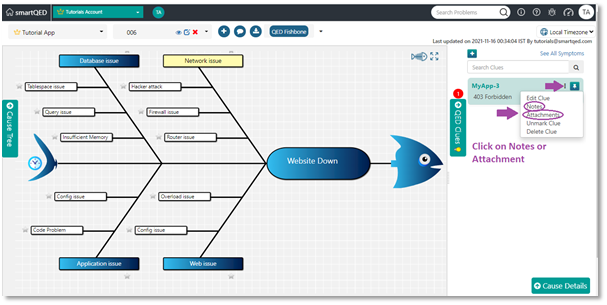
Click on three vertical dots next to the clue in the QED Clues list on the right in the QED Fishbone screen and choose Notes or Attachments from the drop-down list.
Advanced Tips
How do I select the default time zone for entering a Clue/Symptom?
The default time zone set in the Configure App screen is UTC (Coordinated Universal time). Your Application admin can change this default in the Configure App, then Manage Time Zone section.
Alternatively, you can change this default for each individual clue.
Press the Backspace key in the Timezone field of the Add/Edit Clue screen. This gives you a drop-down list of time zones to choose from.
How do I change (unmark) a clue to a symptom?
Click on three vertical ellipsis next to the clue in the QED Clues list on the right in the QED Fishbone screen and choose Unmark Clue from the drop-down list. The clue should disappear from the list of QED Clues. It will still be included in the list of all symptoms, which you can see on the QED Symptoms screen.
To change a symptom back to a clue (mark), click on the unlit light bulb next to the clue in the drill down in the symptoms table. It toggles back to a lit status, re-marking the symptom as a clue.
Step 2: Do Cause Analysis using the Fishbone
To see our video tutorial on this topic, please click here.
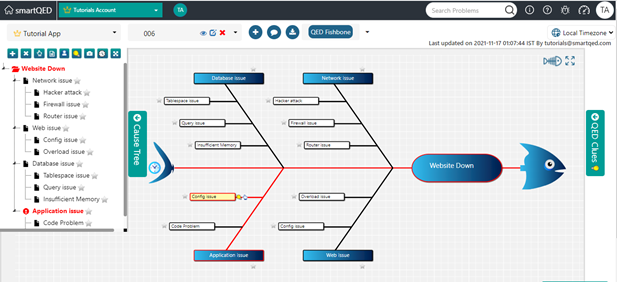
Cause analysis in smartQED is done using an Investigation Map, with Fishbone and Cause tree visualizations which both show the hierarchy of potential causes for the problem. In this guide we use the Fishbone visualization to illustrate the operations. Similar steps can be done on the Cause tree visualization as well.
a. Add a new cause to a fishbone
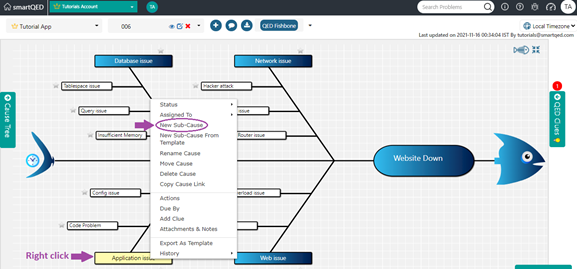
Select the cause to which you want to add a new sub-cause by clicking on the head of the fishbone, or on any other cause. Right click and choose New Sub Cause from the context menu, as shown below.
b. Assign one or more collaborators to a cause
Right click on a cause in the Fishbone and choose Assigned To from the drop-down list.
c. Add Notes and Attachments to a cause
Right click on a cause in the Fishbone and choose Attachments and Notes from the drop-down list.
d. Pin/unpin a clue to/from a cause
You can attach specific evidence to a cause by pinning a clue on it. This indicates to other team members that you are using this clue as evidence for the cause analysis. This information is also used by QED Insights to generate recommendations for future problems.
To pin a clue: Select a cause and click on the pin symbol next to the clue in the QED Clues list on the right of the screen.
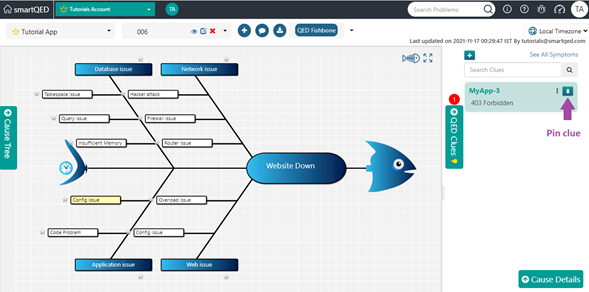
After the pin operation, a light bulb will be displayed for the pinned clue next to the cause in the Fishbone, as shown below.
After the pin operation, a light bulb will be displayed for the pinned clue next to the cause in the Fishbone, as shown below.
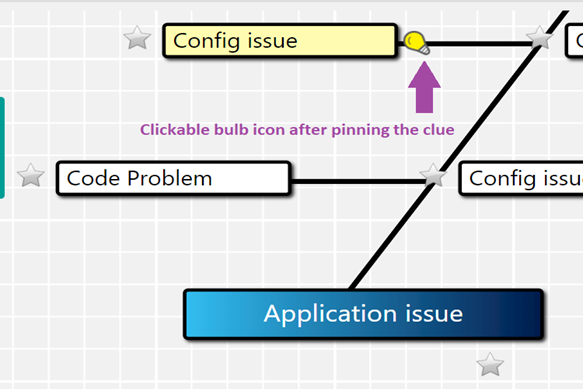
To see all the pinned clues for a cause: Click on the light bulb symbol next to the cause in the Fishbone. A list of pinned clues is displayed.
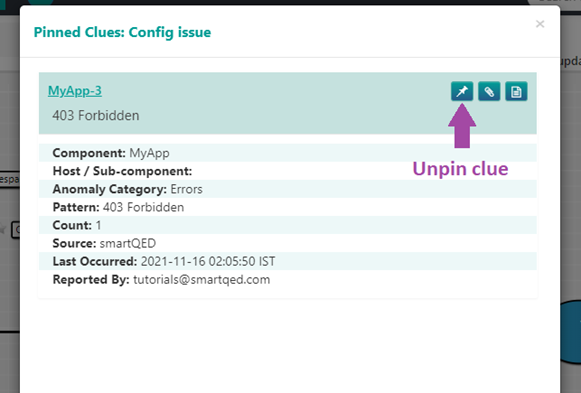
To unpin a clue: Click on the Unpin symbol next to a pinned clue in the list, as shown below. The unpinning puts the clue back to the QED Clues list to the right.
e. Add an action to a cause
Right click on a cause in the Fishbone and choose Actions from the drop-down list.
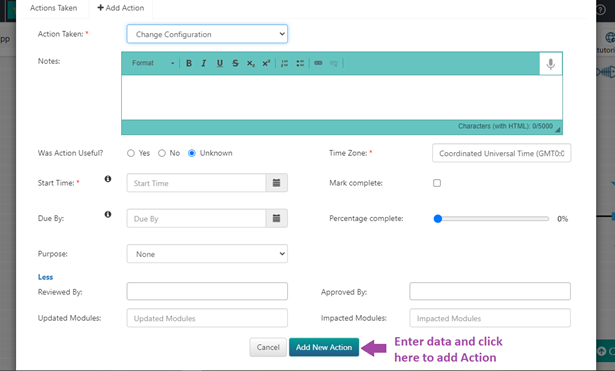
You will see a screen where you can enter the details of the action that you are taking, including the action category, action start and end times, if the action was useful or not etc., as shown below.
You can enter data in the form and then click on Add Action button to save it.
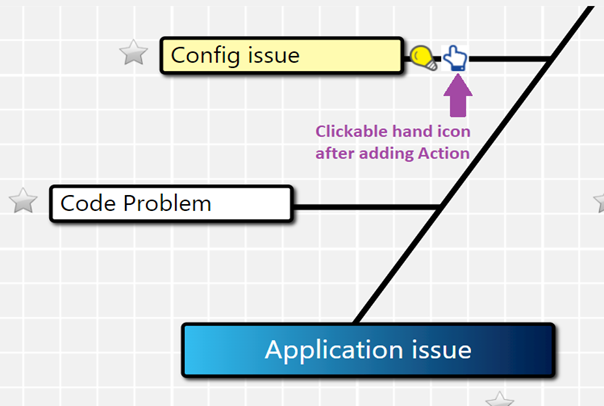
In the screenshot below, we show adding an action for the cause Config Issue under My App issue.
Once you have added the action, a clickable Hand icon will be displayed on the Fishbone cause to which the action was added, as shown below.
f. Change the status of a cause
Right click on a cause in the Fishbone and choose Status from the drop-down list.
Below we show a screenshot of the whole Fishbone after the status of the cause Config issue under MyApp issue was set to At Fault, which propagated the red color all the way to the head cause in the Fishbone.
Advanced Tips
How do I assign priority to a cause?
Click the priority star next to a cause in the fishbone. The star is highlighted in yellow and the priority is set to Urgent. Click the star again to reset the priority back to Normal.
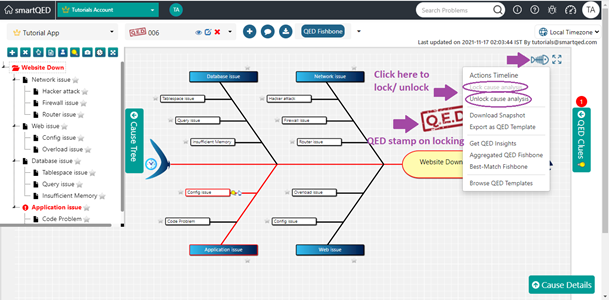
How do I take a snapshot of the Fishbone?
Click on the Fishbone icon on the top right-hand side of the fishbone beside Exit Full Screen button. Select Download Snapshot from the drop-down list.
How do I view the consolidated ‘Actions Timeline’?
Click on the fishbone icon on the top right-hand side of the fishbone. Select View Actions Timeline. It displays consolidated timeline of the start and end of actions for each cause in the tree.
How do I look at the fishbone Time-Lapse view?
Click on ‘Clock’ icon on the fishbone tail in the fishbone. It displays all the operations performed on the fishbone in time sequence.
Step 3: Complete the Problem Investigation
a. Mark the fishbone as QED
Marking a fishbone as QED means that the causes at fault have been diagnosed. Full resolution of the problem may or may not be complete, but the cause analysis is done, and the fishbone can be marked as complete.
Click on the Fishbone icon on the top right-hand side of the fishbone. Select Lock Cause Analysis from the drop-down listto mark it as complete.
The fishbone is now locked and all active collaborators will be notified for that. Further updates to the fishbone cannot be done without first unlocking it.
To unlock, click on the Unlock Cause Analysis in the drop-down list.
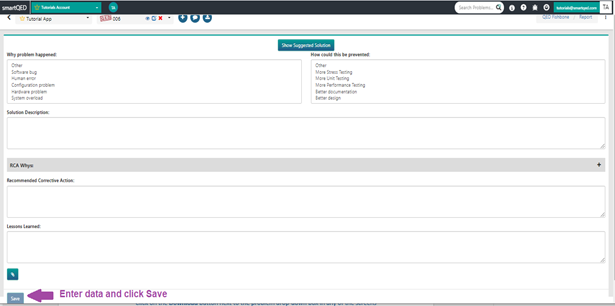
b. Document the Solution
Click on vertical ellipse on top in any of the screens. A drop-down menu appears, choose Solution from the menu.
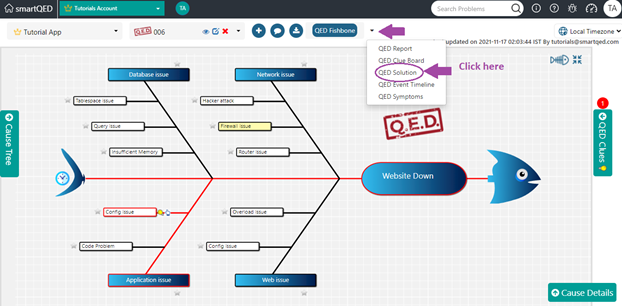
You can document the solution details in this screen, including Why the problem happened, How it could have been prevented, Solution Description, as well as a 5- Whys analysis, Recommended Corrective Action and Lessons Learned.
c. Generate Summary or Detailed Reports
You can see all the updates to a problem on the Reports tab in the on top of any screen.
Click on the Download button next to the problem drop-down box in any of the screens to directly download the Summary Report with default options.
To generate a Summary or Detailed report with custom options, go to the Reports page, select the Report level – Summary/Detailed and click on download Report, and specify your options.
Refer to the Step by Step Guide on Reports for the details.
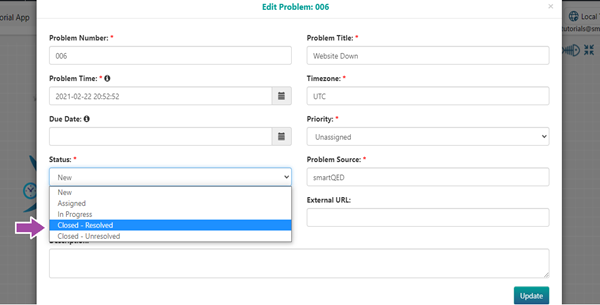
d. Close the Problem
To close the problem, click on the edit icon next to the problem number in the problem drop-down box in the QED Fishbone screen and change the status to Closed – Resolved or Closed — Unresolved.
This displays a green check mark next to the problem number in the problem drop-down box.
Advanced Tips
How can I see closed problems in the Problem panel?
Click on problem drop-down box in the QED Fishbone or any of the other screens. All problems for the application are displayed. Closed problems will have a green check mark next to it.
How can I search and sort the list of all problems?
Click on Show all problems on the top right of the problem panel in the QED Symptoms screen.
How do I auto-email reports to stakeholders?
This feature is not available in the free plan, you need to upgrade your account to a priced plan. Only the Application owner has the privilege to customize the auto-email feature. Go to the Configure App page and select Customize: Auto Reporting. Click on the check box to change the scheduling intervals and the priorities of the problems to be included in the auto-email feature.
Hope you found this information useful. If you have any questions, please contact us at [email protected].
Please visit our website at https://smartqed.ai to get the latest news and blogs.